The Natura 2000 (N2000 or N2K) network was established in 1992 to designate nature protection areas in the territory of the European Union. On land it consists of Special Areas of Conservation (SACs) and Special Protection Areas (SPAs) designated by the Habitats and Birds Directives. In total over 26,900 N2000 sites represent around 18 percent of land of the EU countries.

Copernicus is the European programme for monitoring the Earth from space. Data is collected by different sources, including a fleet of satellites and in-situ sensors and made freely and openly available. The constellation of Sentinel satellites represents the most powerful and capable environmental monitoring system developed to date. The data is also processed to provides reliable and up-to-date information products to support user and downstream services.
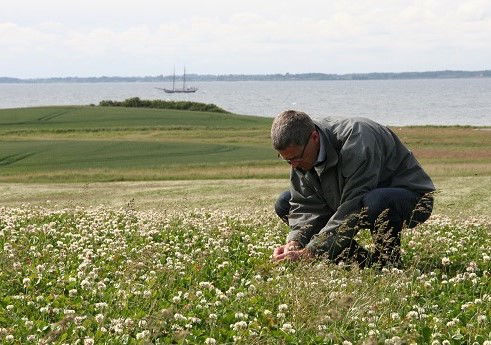
To maintain and improve the N2000 network it is necessary to monitor and report on the habitats and species present in each of the sites. The Copernicus land theme provides a range of products including some directly related to N2000 sites and grasslands. However, for effective management and to address pressures easy access to temporally detailed information and indicators is required.
The previous project developed a prototype version of EU Grassland Watch to support the monitoring and management of N2000 site with a focus on grasslands and thereby assess the health of protected areas / ecosystems through time. The Copernicus programme will provide valuable resources for mapping and monitoring the sites through existing ready to use service products and operational Earth Observation (EO) image acquisitions. The results of the analysis processes will be exposed to users through a user-friendly and intuitive webtool to support their reporting and management needs at a range of scales from the pan-European to site levels.
The pages below provide more detail on the operation of the service, the webtool and use cases.
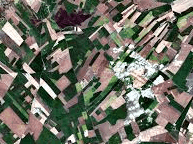
The Cop4N2K project uses optical images from both the Copernicus Sentinel-2 and the US Landsat systems to allow for the filling of gaps filling by clouds, cloud shadow and snow. The use of Landsat data also allows the extension of the time series of grassland information back to 1994.
Optical data is more familiar to users of aerial photographs as it is similar to the human eye. The sensors record reflected sunlight which relates mainly to the chemical composition of the surface. Optical data are influenced by the colour of the surface materials, pigments and moisture content within vegetation, and within leaf and canopy structure.

The Cop4N2K project also uses Synthetic Aperture RADAR (SAR) images from Copernicus Sentinel-1 system to support the monitoring process from 2014 onwards. SAR is an all-weather day and night active system so there is no need for gap filling caused by clouds.
Due to the wavelengths used SAR the data recorded relates to the macro-scale structure of the surface that we would perceive as roughness. For instance it is useful for discriminating between smooth bare fields, different crop patterns, scrub encroachment and highly structured forest canopies. In this way the optical and SAR data will be complementary in delivering the information need for the service.
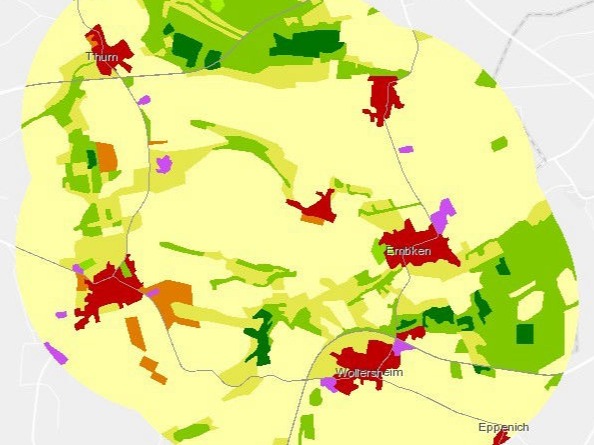
To guide the processing of the EO data and hold the results of the analysis a number of reference datasets were used.
The Copernicus Land Monitoring Service (CLMS) produces a N2K grassland hot spot monitoring product as part of its local component services. The N2K status layer consists of vector reference objects differentiated into 55 thematic land cover / land use (LC / LU) classes. The reference objects were used to hold the results of the EO analysis.
The CORINE Land Cover map was used to provide training data for the classification processes described below.

The expansion of EO data acquisition capabilities put huge pressure on data storage and processing facilities. The five Copernicus Data and Information Access Services (DIAS) providing centralised access to Copernicus data and information, plus non-Copernicus geospatial data and scalable processing tools within cloud-based platforms to handle the required processing load.
Based on the requirements of the processing chain and the preferences of the European Commission, the production system was implemented on CREODIAS cloud computing infrastructure.
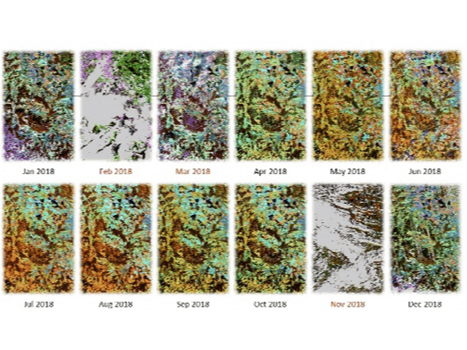
To generate the optimal data for land cover / land use classification individual images were combined over short time periods. Separate optical and SAR multi-temporal composites are formed to generate monthly images (3-monthly before 2016).
The optical composites minimised or removed any cloud / snow contamination. The monthly spectral composites are complimented by annual statistics of the normalized difference vegetation index (NDVI). The SAR data are temporally aggregated in similar way to the optical data for the three polarisations (VH, VV, VH/VV ratio) available from Sentinel-1.
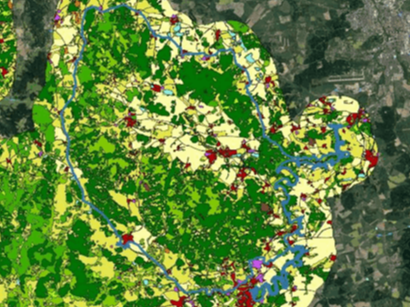
The optical and SAR composites are classified separately using a Support Vector Machine (SVM) approach based on training data from the existing CLMS N2K and CORINE land cover products. The two results are then merged by a simple rule of highest SVM probability to give a single LC / LU map for each year.
The yearly maps allow change products and thus monitoring from the 1990s to the present and beyond. The raster-based LC / LU maps are then aggregated to the level of the reference objects from the CLMS N2K product. The output vector layer includes the fractions of each class per object plus biophysical properties.
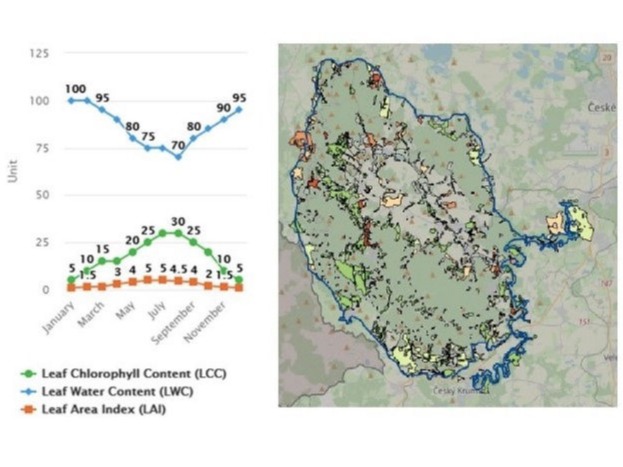
All data produced by the EO analyses need to be transform into actionable information which can be interpreted for particular needs and then used to drive management actions or policy development.
An indicator is a variable that represents one or more properties of a habitat patch or region and is usually derived from one or more input data sets. Indicators can summarise the complex status of a feature and then be used as triggers for action. They are usually linked to one or more policy areas and often written in to the policy formulation and, thus, they are designed to respond to policy questions.
When evaluated at regular intervals, an indicator can highlight the trends or direction of change across different units and are useful for drawing attention to particular issues and therefore setting policy responses and priorities.
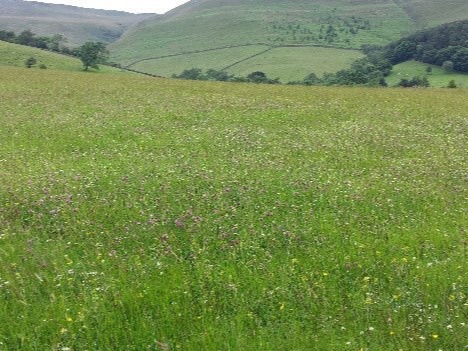
Indicators for grassland monitoring represent a complex topic with a large amount of background research. A large collection of potential indicators which could be used at sites levels have been compiled and reviewed.
In this service the initial indicators adopted relate to status and change / flow of composition:
• Grassland surface cover
• Grassland cover changes
• Class diversity
• Grassland permanence
The indicators will be produced using the land cover / land use information derived from the EO data for each year. They will be compiled at the database level and reported through the webtool described below at the site, region, country and European levels. Access to both indicators and underlying information allows a more thorough understanding of the situation.
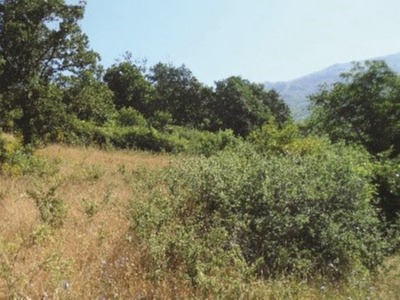
Of particular interest are indicators of grassland abandonment and intensification to track compliance with conservation policies. The key question is whether the N2000 sites are fit for purpose and whether their grasslands are effectively protected. The Directive clearly states that a deterioration of the habitat status is to be avoided.
The aim of the projects is to develop a service which makes the status and changes of the indicators visible to expert users and the wider public. That service should inform about problematic developments, hotspots of grassland loss and also improvements. More generally, to what extent is N2000 performing well, which is a question of quantity and quality. The distinction between grasslands of high biodiversity value (unmanaged / extensively used) and low biodiversity value (fertilized and often mowed / intensively used) is important in that context.
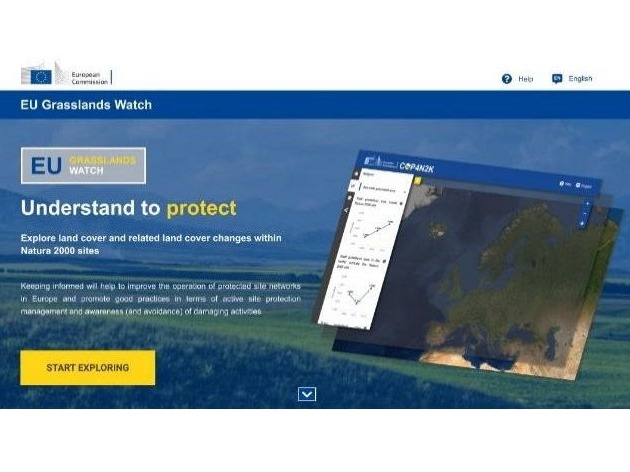
The EU Grasslands Watch webtool will provide access to the results of the LC / LU mapping and indicators for each of the selected N2000 sites in a clear and dynamic way. It will allow the wealth of information to be accessible and understandable to the end user.
The key goal is to inform stakeholders and citizens about the context, evolution and conservation status of specific natural habitat types and species, and the ecological trends of the N2000 network sites across Europe. It should also aim to be transparent, thus encouraging public participation in raising awareness of damaging activities and engage with them in the protection of the sites.
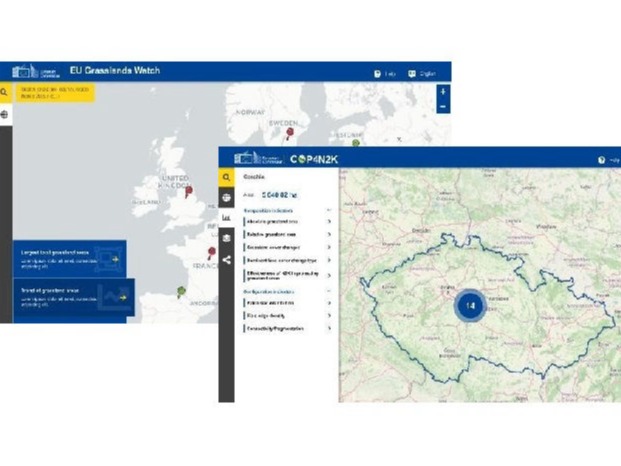
The webtool displays the results at a range of reporting levels to support stakeholders at local to European scales. Over larger areas the webtool will show summaries of the indicators and visualisations of hotspots related to both positive and negative performance. The information displayed can be tailored to the particular policy or management question under investigation.
The webtool will be updated at regular intervals once fully operational and access to the fully time series will be possible. The information layers (e.g. LC / LU for a particular year) will be downloadable individual for expert users for processing in their own systems.
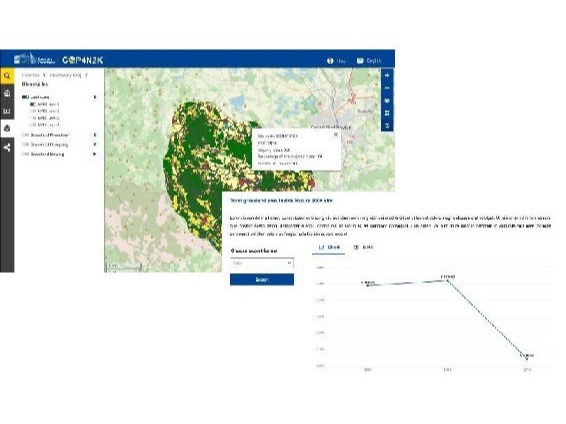
The webtool visualises all the results held in the database including the LC / LU mapping, indicators and data from other sources. The information will be held on the reference objects from the CLMS N2K product.
At the site level the designated area plus a 2 km buffer around can be visualised to see individual habitat patches and features. The results can be interrogated in a number of ways including plots showing the temporal properties of indicators.
The user can visualise the indicators and EO-based products in the webtool, and can share the URL for a particular view or result for easier dissemination.

Site managers could use the EU Grassland Watch for a wide range management activity.
For instance, the impacts of historical (post 1990) and current restoration projects could be reviewed to see their value and sustainability over time. In this way future projects could be better designed and targeted to particular areas and situations to maximise the outcomes.
Over large area, individual habitat patches are field can be tracked to identify changes in land management which are detrimental to that habitat type or the site as a whole.
Desk officers at regional to international levels can easily pull up the details of a particular site to detect weak implementation of their management plans or potential infringement (particularly in the case of grasslands destruction). Here the time series of information are vital and provide a clear advantage to detect a potential problem early, before going back to historical aerial photos or inquiring more in detail locally.

EU Grassland Watch will help countries (e.g. environment ministries and their agencies) get an overview of the evolution of grasslands, at fine spatial resolution since the 1990s. This may be a novel approach for some countries which have a less geospatial approach to monitoring. By offering them satellite data processed as a standard product the service helps them to get a more accurate picture of the evolution in their sites. Countries will have to designate more protected areas in the future and make some strategical choices to reach the targets of the biodiversity strategy, therefore this tool would be a first common base in this endeavour.
In its current version, EU Grassland Watch reports for N2K sites dominated by grassland and a 2 km buffer around them. The service could be extended in the future to other N2K sites or even the whole national surface. If this was done, we would have a tool helping countries to report on grasslands under art 12/17 of the Habitat Directive (in particular to know quickly the regions where to prioritize field visits).

Hot spot maps at the EU scale will be used to observe the trends in the losses and degradations of grassland status estimated with the indicators of intensification / abandonment. This information is related to the targets set in the EU Biodiversity Strategy for 2030 which aims for no further degradation in conservation trends and status by 2030. The information on conservation status provided by the EU Grassland Watch will be the first step in supporting the European Green Deal and demonstrating the effectiveness of EO-based decision making.
The benefit of halting degradation and losses (or improving the trends) of grasslands could have positive impacts on animal species too (e.g. birds, butterflies). The service will therefore also support priorities areas such as reversing the decline of pollinators by creating a context in which later developments could be achieved.
Therefore, at the European level the service allows to see the challenges / issues to be addressed when implementing policies / strategies.

Landing Page Builder